


Quick Summary
-
Two of the most widely cited aggregate measures of customer experience quality in the U.S. (the Forrester CX Index and the American Customer Satisfaction Index) are sending diverging signals.
-
The inverse correlation between these two oft-quoted measures underscores a key challenge for customer experience professionals — articulating a consistent and compelling story about CX to executive stakeholders.
-
The discrepancy between the two indices also illustrates how CX measurement practices (such as which industries are sampled and how “satisfaction” is defined) can have an outsized influence on the metrics themselves.
[Editor’s note: This post was last updated on September 14, 2026.]
Customer experience quality in the U.S. has just seen a “modest but important improvement.”
And, in related news, customer experience quality in the U.S. has also “declined sharply.”
Let the confusion begin…
That first finding comes from Forrester Research’s 2026 “U.S. Customer Experience (CX) Index” study, released on August 3, 2026. The second comes from the Q2 2026 “American Customer Satisfaction Index (ACSI),” released on August 11, 2026.
These are two of the most widely cited national studies that gauge how U.S. consumers are feeling towards the businesses they patronize. Released a mere eight days apart, they draw two very different conclusions about the current state of consumer satisfaction. But wait, there’s even more intrigue here:
The chart below shows the 11-year trend for each measure.
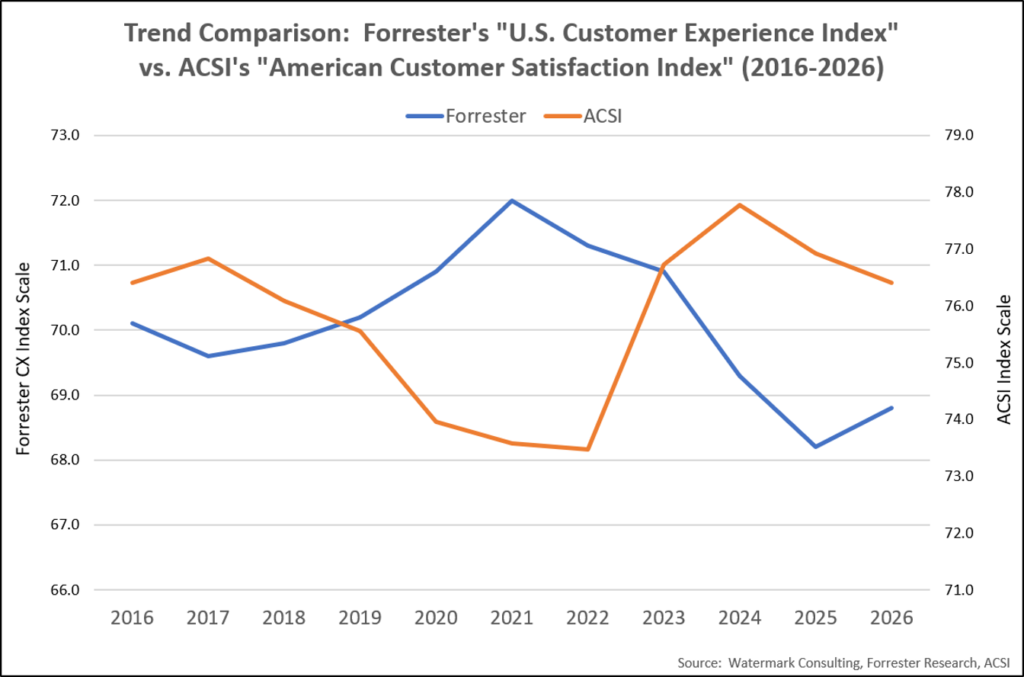
Notice anything interesting about these two line graphs? That’s right – they are almost perfect mirror images of one another. From 2016 through 2026, these two vaunted measures of customer experience moved in nearly lockstep OPPOSITE directions.
Granted, the two studies use different methodologies for scoring customer experience: According to the companies’ descriptions of their respective studies, the Forrester Index focuses on “effectiveness, ease, and emotion” whereas the ACSI focuses on “customer expectations, perceived quality, and perceived value.” But to the casual observer, those distinctions are meaningless.
What business leaders see is an industry that can’t get its story straight: Is customer experience quality improving or deteriorating? Is it at an all-time high or an all-time low? Apparently, it wholly depends on the Customer Experience Index you happen to be citing – which isn’t a good look for the CX discipline.
Below are four important lessons to be learned from the curious inverse correlation between the Forrester and ACSI indices – lessons that should influence not just how people interpret these closely-watched measures, but also how they gauge customer experience quality within their own businesses:
1. Customer satisfaction is a poor measure of customer engagement.
One subtle but potentially important difference between these two indices is that Forrester’s measure explicitly targets the customer’s emotional reaction to the business encounter, whereas the ACSI appears to be more focused on customers’ rational evaluation of the interaction (relative to their expectations).
That distinction matters – because, ultimately, what really drives customers’ willingness to purchase (and repurchase) from a business isn’t their logical assessment of the encounter (delivery vs. expectations). More influential is the emotional resonance of the interaction – how it made the customer feel.
The ACSI might have a blind spot in this regard, though it’s admittedly hard to imagine that alone accounting for the near-perfect mirror image trend between the two measures.
2. How and what you measure makes all the difference.
Both Forrester and ACSI use proprietary formulas to calculate their indices. Read the methodology overviews for either of them and you’ll see cryptic references to “weighted algorithms,” “multi-equation econometric models,” and “multivariable measurement components.” There isn’t a whole lot of transparency around these calculations, so it’s hard to know if the formulas themselves could account for such disparate results.
The industries covered by these firms’ consumer surveys can also make a difference. If one index has a much greater representation from durable goods companies, while the other is more focused on the service sector – that could drive variations in the results. Fact is, however, the industries targeted by the two indices are actually quite similar.
Even the survey wording and response scales used for these indices (or any Voice-of-the-Customer metric) can sway the results. A misplaced conjunction, an imbalanced survey scale, and even the order in which questions are presented – these can all materially influence the customer feedback scores.
Unfortunately, given the secrecy that shrouds the Forrester and ACSI measures, we’ll probably never know what exactly is driving the divergence in their results. Nevertheless, the key lesson to take away is that even subtle differences in the design and deployment of a customer survey can have a surprisingly significant impact on the resulting insights.
3. Changes in scores may not reflect real changes in customer experience quality.
Business performance measures should always be viewed from the (often overlooked) perspective of statistical significance. Metrics, including the Forrester and ACSI indices, will rise and fall over time – but if those changes are not statistically significant (i.e., they exceed the normal, mathematically expected variation in the measure), then they’re meaningless.
Businesses routinely rejoice when they observe an improvement in their customer experience metrics. But if a month-over-month increase isn’t statistically significant, then there’s really nothing to celebrate. Conversely, executives browbeat their teams when they witness a decline in these measures – but, again, if the deterioration is within the window of expected variation, then nothing has really changed in the underlying environment, and no one deserves to be scolded.
It’s worth noting that over the last eleven years, the Forrester and ACSI measures have tracked within a rather narrow band. Creatively scaled Y-axes can make the year-over-year trends look seismic, but in reality, both measures during that period fell within a tight band of their 100-point scales (3.8 points for the Forrester Index and 4.3 points for the ACSI). While both companies assert that even those small changes are statistically significant ones, the important lesson is simply this: It’s a dangerous game to draw conclusions from performance metric trends without evaluating those changes through a statistical lens.
4. The best gauge of customer experience… is your own experience.
So who’s right and who’s wrong? Is Forrester’s view of the world more accurate than ACSI’s? Is customer experience quality rising or falling?
If the mirror image comparison tells us anything, it’s that these nationwide, cross-industry customer experience indices can, at best, be ambiguous and, at worst, be completely contradictory.
So, if you want an answer to the question “What is the state of customer experience in America today” – consider these CX indices in the context of your own customer experiences (and those you hear about from friends, family, and colleagues). Reflecting on the companies you regularly patronize, from Fortune 100 firms to small, local businesses, ask yourself:
- Do they consistently do what they say they’re going to do – calling you back when promised, providing information you’ve requested, etc.?
- Do they respect your time and avoid wasting it – or do you find yourself perpetually waiting in call queues and checkout lines?
- Is it easy to find someone when you need help (online, over the phone, or in a store)? Someone who’s competent, courteous, and inspires your confidence in the business?
- Do the businesses’ employees take ownership for assisting you, or do you find you’re passed off from one department to another?
- Do their interactions with you exude hospitality? Or have they stripped their customer experience of all humanity, subjecting you to maddeningly unhelpful AI-powered chatbots and marketing pitches?
- Do they communicate clearly with you, conveying information in a simple, easy-to-understand manner that resolves all of your questions, rather than triggering new ones.
- Do they anticipate your needs and treat you like an individual – or do they seem to view you as just another revenue source?
- Do they advocate for your best interests? Or do they only seem to be interested in lining their own pockets?
- Do your interactions with them elicit positive emotions such as happiness, serenity, and confidence? Or do you instead experience frustration, confusion, and doubt?
- Overall, do you feel better after you’ve interacted with these businesses as compared to before? Do they make you feel enriched… or exploited?
Ponder these questions and what you’ll probably come to realize is that you don’t really need a professionally-produced nationwide CX index to clue you in to the current state of customer experience… because you knew the answer all along.
[A version of this article originally appeared on Forbes.com.]
Jon Picoult is founder of Watermark Consulting, a customer experience advisory firm that helps companies impress customers and inspire employees, creating raving fans that drive business growth. Author of the Wall Street Journal featured book “From Impressed To Obsessed,” Picoult is a widely respected keynote speaker, as well as an advisor to some of the world’s foremost brands. Follow Jon on LinkedIn or Instagram, or subscribe to his monthly eNewsletter.